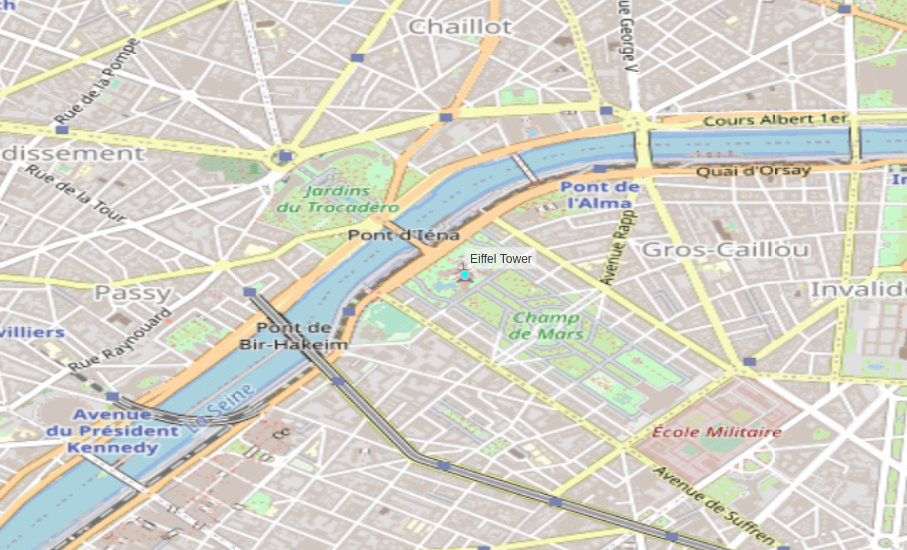
In any GIS, a map comprises georeferenced data layers; the source data can be vectors or rasters. We can use tile or vector layer for both types of source data to display it in web mapping. OpenLayers supports all of these combinations. A tile layer comprises different images generated server-side displayed as an array. It is very fast because it is generally cached (server and client-side), but the downside is that we cannot access the map entities directly in Javascript.
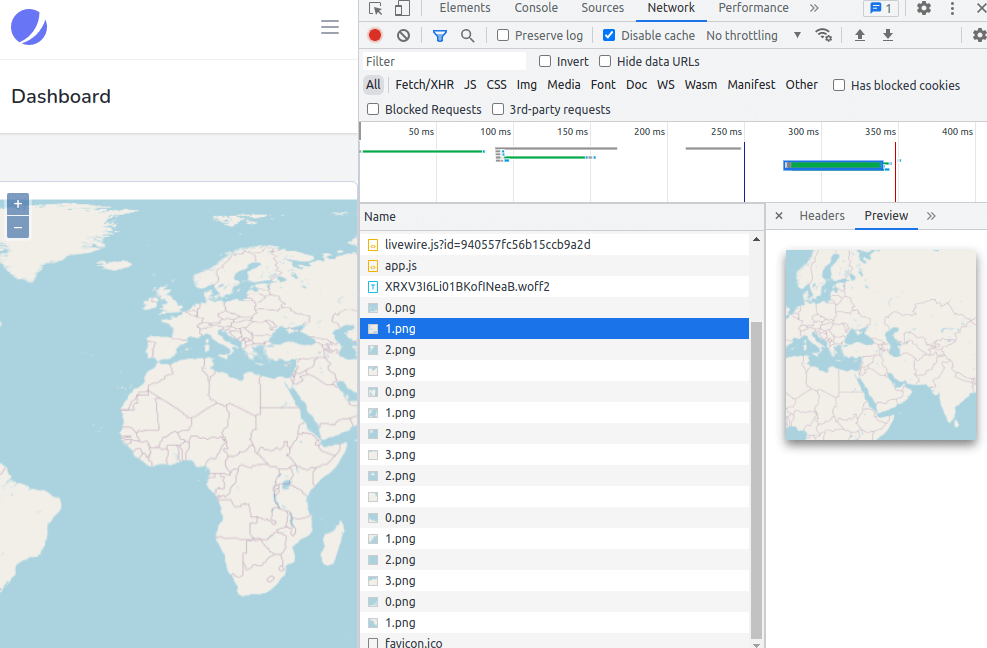
- The OpenStreetMap we are currently using is a tile layer; we can witness it in our browser dev tools in the network tab; we can see all tiles loaded from OpenStreetMap servers and displayed all together by OpenLayers:
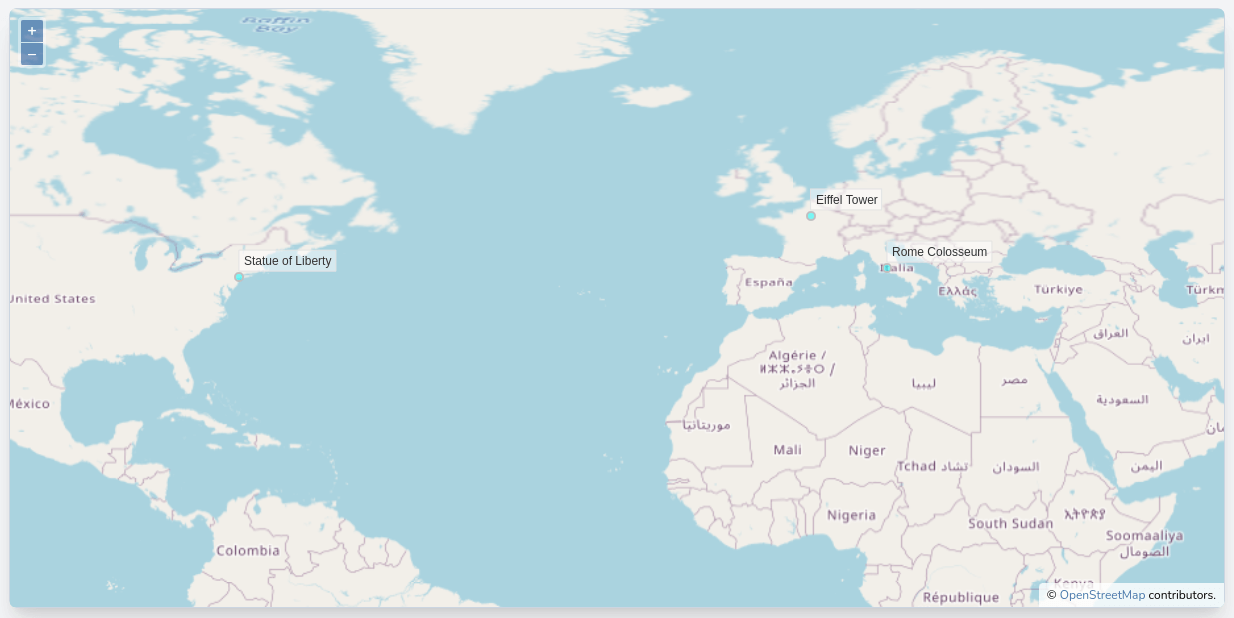
- Now, we will try to overlay some static points (points are vectors) on our map with the OpenStreetMap layer we already have, in our map.js file; let's make the following changes (don't forget to run "dr npm run build" before reloading the page, we will cover how to use vite with hot reload in a futur post):
import Map from 'ol/Map.js';
import View from 'ol/View.js';
import TileLayer from 'ol/layer/Tile.js';
import Feature from 'ol/Feature';
import VectorSource from 'ol/source/Vector';
import VectorLayer from 'ol/layer/Vector';
import OSM from 'ol/source/OSM.js';
import Point from 'ol/geom/Point';
import { Style, Fill, Stroke, Circle, Text } from 'ol/style.js';

document.addEventListener('alpine:init', () => {
    Alpine.data('map', function () {
        return {
            map: {},
// a vector source is composed of features, which are basically objects with a geometry (point in
// our case) and attributes (name in this example), we initialize our component variable to an
// array of 3 features:
            features: [
                new Feature({
                    geometry: new Point([2.2944960089681175, 48.85824068679814]),
                    name: 'Eiffel Tower',
                }),
                new Feature({
                    geometry: new Point([-74.04455265662958, 40.68928126997774]),
                    name: 'Statue of Liberty',
                }),
                new Feature({
                    geometry: new Point([12.492283213388305, 41.890266877448695]),
                    name: 'Rome Colosseum',
                }),
            ],
            init() {
                this.map = new Map({
                    target: this.$refs.map,
                    layers: [
                        new TileLayer({
                            source: new OSM(),
                        }),
// we add an extra vector layer to the map with the source using our local component features
// variable
                        new VectorLayer({
                            source: new VectorSource({
                                features: this.features,
                            }),
// we call a function for the style, this function will receive each individual feature
                            style: this.styleFunction,
                        })
                    ],
                    view: new View({
                        projection: 'EPSG:4326',
                        center: [0, 0],
                        zoom: 2,
                    }),
                })
            },
// The styleFunction defines how each feature will look on the map, it receives
// each individual feature, we will use this later to conditionaly style them.
// The styleFunction also defines labels for our features, based on their name
// attributes in our example. The style will represent a circle with a 4px radius
// with fill and stroke colors, for the label, we get a little fancy and make it
// offset with a transparent background, this example is a first demonstration
// on how to symbolize a layer of points.
            styleFunction(feature) {
                return new Style({
                    image: new Circle({
                        radius: 4,
                        fill: new Fill({
                            color: 'rgba(0, 255, 255, 0.5)',
                        }),
                        stroke: new Stroke({
                            color: 'rgba(192, 192, 192, 1)',
                            width: 2
                        }),
                    }),
                    text: new Text({
                        font: '12px sans-serif',
                        textAlign: 'left',
                        text: feature.get('name'),
                        offsetY: -15,
                        offsetX: 5,
                        backgroundFill: new Fill({
                            color: 'rgba(255, 255, 255, 0.5)',
                        }),
                        backgroundStroke: new Stroke({
                            color: 'rgba(227, 227, 227, 1)',
                        }),
                        padding: [5, 2, 2, 5]
                    })
                })
            }
        };
    });
});
After a page reload in the browser, the map should look like this:
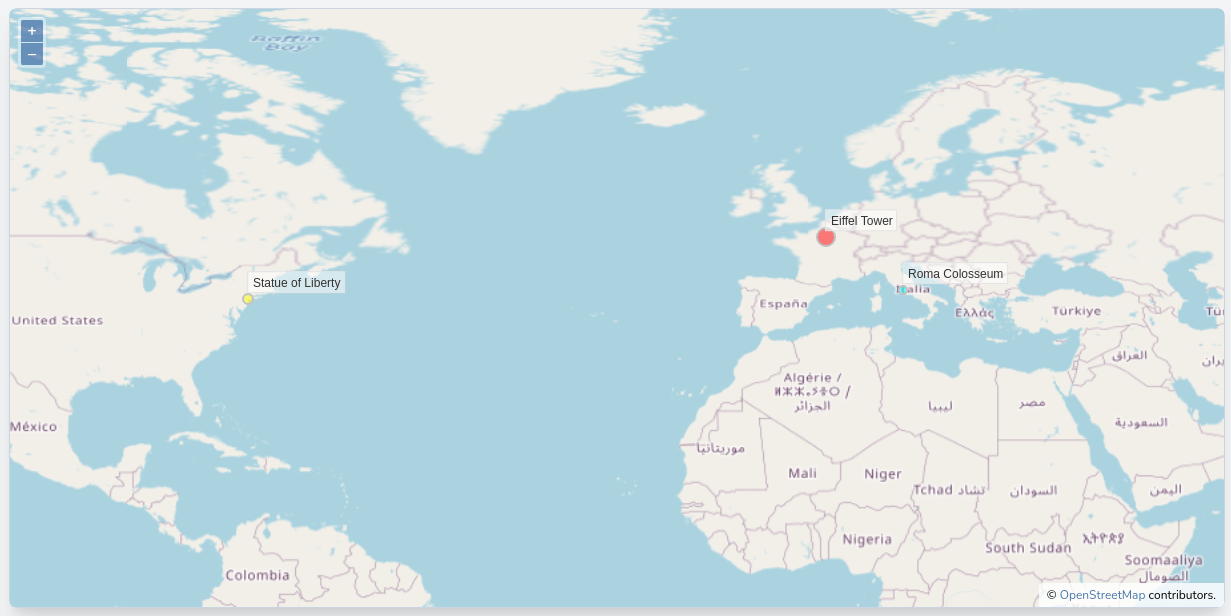
Now, let's make a few tweaks to style our points based on a new conditionally numerical attribute: yearly_visitors:
import Map from 'ol/Map.js';
import View from 'ol/View.js';
import TileLayer from 'ol/layer/Tile.js';
import Feature from 'ol/Feature';
import VectorSource from 'ol/source/Vector';
import VectorLayer from 'ol/layer/Vector';
import OSM from 'ol/source/OSM.js';
import Point from 'ol/geom/Point';
import { Style, Fill, Stroke, Circle, Text } from 'ol/style.js';

document.addEventListener('alpine:init', () => {
    Alpine.data('map', function () {
        return {
            map: {},
// we add a new yearly_visitors attribute to each of the features
            features: [
                new Feature({
                    geometry: new Point([2.2944960089681175, 48.85824068679814]),
                    name: 'Eiffel Tower',
                    yearly_visitors: 8810000,
                }),
                new Feature({
                    geometry: new Point([-74.04455265662958, 40.68928126997774]),
                    name: 'Statue of Liberty',
                    yearly_visitors: 4600000,
                }),
                new Feature({
                    geometry: new Point([12.492283213388305, 41.890266877448695]),
                    name: 'Rome Colosseum',
                    yearly_visitors: 3800000,
                }),
            ],
            init() {
                this.map = new Map({
                    target: this.$refs.map,
                    layers: [
                        new TileLayer({
                            source: new OSM(),
                        }),
                        new VectorLayer({
                            source: new VectorSource({
                                features: this.features,
                            }),
                            style: this.styleFunction,
                        })
                    ],
                    view: new View({
                        projection: 'EPSG:4326',
                        center: [0, 0],
                        zoom: 2,
                    }),
                })
            },
            styleFunction(feature) {
// in the styleFunction, instead of hardcoding the circle radius, we calculate it
// base on the yearly_visitors attribute. We also set differents colors based on
// a range:
                let radius = Math.round(feature.get('yearly_visitors') / 1000000)

                let color = 'rgba(0, 255, 255, 0.5)'

                if(radius > 4) {
                    color = 'rgba(255, 255, 0, 0.5)'
                }

                if(radius > 5) {
                    color = 'rgba(255, 0, 0, 0.5)'
                }

                return new Style({
                    image: new Circle({
                        radius: 4,
                        radius: radius,
                        fill: new Fill({
                            color: 'rgba(0, 255, 255, 0.5)',
                            color: color,
                        }),
                        stroke: new Stroke({
                            color: 'rgba(192, 192, 192, 1)',
                            width: 2
                        }),
                    }),
                    text: new Text({
                        font: '12px sans-serif',
                        textAlign: 'left',
                        text: feature.get('name'),
                        offsetY: -15,
                        offsetX: 5,
                        backgroundFill: new Fill({
                            color: 'rgba(255, 255, 255, 0.5)',
                        }),
                        backgroundStroke: new Stroke({
                            color: 'rgba(227, 227, 227, 1)',
                        }),
                        padding: [5, 2, 2, 5]
                    })
                })
            }
        };
    });
});
After a "dr npm run build" and page reload in the browser, the map should look like this:
- Now that we have some layers and data to work with, let's create a legend panel with more control and feedback on our map. The user will be able to use a button to toggle the legend. Let's make the following changes to resources/views/components/map.blade.php file:
<div x-data="map()">
    <div x-ref="map" class="map h-[600px] rounded-md border border-slate-300 shadow-lg">
    <div x-ref="map" class="relative h-[600px] rounded-md border border-slate-300 shadow-lg">
      <!-- Create an absolute panel relative to the map dom element to contain our trigger button -->
         <div class="absolute top-2 right-8 z-10 rounded-md bg-white bg-opacity-75">
             <div class="ol-unselectable ol-control">
                 <button x-on:click.prevent="legendOpened = ! legendOpened"
                     title="Open/Close legend"
                     class="absolute inset-0 flex justify-center items-center">
                     <!-- Heroicon name: outline/globe -->
                     <svg xmlns="http://www.w3.org/2000/svg" class="h-5 w-5 pl-0.5" fill="none" viewBox="0 0 24 24" stroke="currentColor" stroke-width="1">
                         <path stroke-linecap="round" stroke-linejoin="round" d="M3.055 11H5a2 2 0 012 2v1a2 2 0 002 2 2 2 0 012 2v2.945M8 3.935V5.5A2.5 2.5 0 0010.5 8h.5a2 2 0 012 2 2 2 0 104 0 2 2 0 012-2h1.064M15 20.488V18a2 2 0 012-2h3.064M21 12a9 9 0 11-18 0 9 9 0 0118 0z" />
                       </svg>
                 </button>
             </div>
         </div>
    <!-- Create an absolute panel relative to the map dom element to contain our legend -->
         <div x-show="legendOpened" x-transition:enter="transition-opacity duration-300"
              x-transition:enter-start="opacity-0" x-transition:enter-end="opacity-100"
              x-transition:leave="transition-opacity duration-300" x-transition:leave-start="opacity-100"
              x-transition:leave-end="opacity-0"
              class="absolute right-0 top-16 left-2 bottom-2 z-10 max-w-sm rounded-md bg-white bg-opacity-50 shadow-sm">
             <div class="absolute inset-1 rounded-md bg-white bg-opacity-75 p-2">
                 Legend panel content
             </div>
         </div>
    </div>
</div>

@once
    @push('styles')
        @vite(['resources/css/components/map.css'])
    @endpush
    @push('scripts')
        @vite(['resources/js/components/map.js'])
    @endpush
@endonce
Now let's add the legendOpened status attribute on the map component (resources/js/components/map.js):
(...)
document.addEventListener('alpine:init', () => {
    Alpine.data('map', function () {
        return {
            legendOpened: false,
            map: {},
            features: [
                new Feature({
                    geometry: new Point([2.2944960089681175, 48.85824068679814]),
                    name: 'Eiffel Tower',
                    yearly_visitors: 8810000,
                }),
                new Feature({
                    geometry: new Point([-74.04455265662958, 40.68928126997774]),
                    name: 'Statue of Liberty',
                    yearly_visitors: 4600000,
                }),
                new Feature({
                    geometry: new Point([12.492283213388305, 41.890266877448695]),
                    name: 'Rome Colosseum',
                    yearly_visitors: 3800000,
                }),
            ],
            init() {
(...)
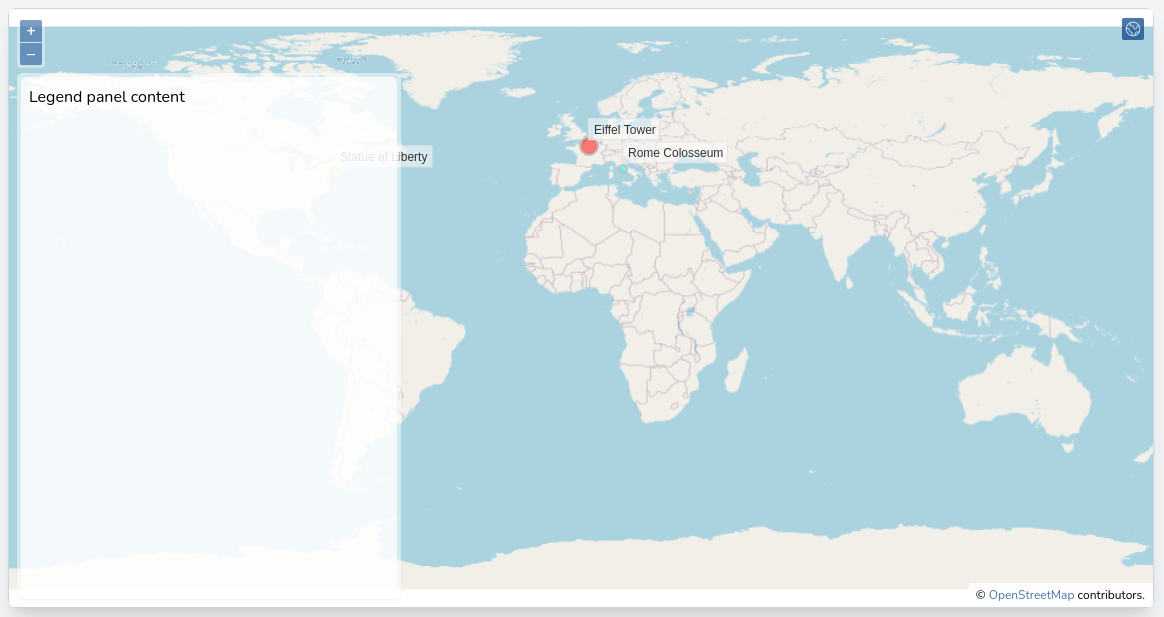
After a "dr npm run build" and page reload in the browser, you should be able to click the Open/Close legend button at the top right corner of the map and open the legend panel like this:
- Let's make a true legend in our panel; please note that I'm using Tailwind css and alpine.js transition helpers to style the controls as close as possible to the default OpenLayers styles. Make the following changes to the resources/views/components/map.blade.php file:
<div x-data="map()">
<div x-ref="map" class="relative h-[600px] rounded-md border border-slate-300 shadow-lg">
<div class="absolute top-2 right-8 z-10 rounded-md bg-white bg-opacity-75">
<div class="ol-unselectable ol-control">
<button x-on:click.prevent="legendOpened = ! legendOpened" title="Open/Close legend"
class="absolute inset-0 flex items-center justify-center">
<!-- Heroicon name: outline/globe -->
<svg xmlns="http://www.w3.org/2000/svg" class="h-5 w-5 pl-0.5" fill="none" viewBox="0 0 24 24"
stroke="currentColor" stroke-width="1">
<path stroke-linecap="round" stroke-linejoin="round"
d="M3.055 11H5a2 2 0 012 2v1a2 2 0 002 2 2 2 0 012 2v2.945M8 3.935V5.5A2.5 2.5 0 0010.5 8h.5a2 2 0 012 2 2 2 0 104 0 2 2 0 012-2h1.064M15 20.488V18a2 2 0 012-2h3.064M21 12a9 9 0 11-18 0 9 9 0 0118 0z" />
</svg>
</button>
</div>
</div>
<div x-show="legendOpened" x-transition:enter="transition-opacity duration-300"
x-transition:enter-start="opacity-0" x-transition:enter-end="opacity-100"
x-transition:leave="transition-opacity duration-300" x-transition:leave-start="opacity-100"
x-transition:leave-end="opacity-0"
class="absolute right-0 top-16 left-2 bottom-2 z-10 max-w-sm rounded-md bg-white bg-opacity-50 shadow-sm">
// We use x-cloak (present in resources/css/app.css) to avoir seeing the panel flicker on page load
<div x-cloak x-show="legendOpened" x-transition:enter="transition-opacity duration-300"
x-transition:enter-start="opacity-0" x-transition:enter-end="opacity-100"
x-transition:leave="transition-opacity duration-300" x-transition:leave-start="opacity-100"
x-transition:leave-end="opacity-0"
class="absolute right-0 top-16 left-2 bottom-2 z-10 max-w-sm rounded-md border border-slate-300 bg-white bg-opacity-50 shadow-sm">
<div class="absolute inset-1 rounded-md bg-white bg-opacity-75 p-2">
Legend panel content
<div class="flex items-start justify-between">
<h3 class="text-lg font-medium text-slate-700">Legend</h3>
<button x-on:click.prevent="legendOpened = false"
class="text-2xl font-black text-slate-400 transition hover:text-[#3369A1] focus:text-[#3369A1] focus:outline-none">×</button>
</div>
<ul class="mt-2 space-y-1 rounded-md border border-slate-300 bg-white p-2">
// Loop through map layers (in reverse order to get the base layers at the en of the list)
<template x-for="(layer, index) in map.getAllLayers().reverse()" :key="index">
<li class="flex items-center px-2 py-1">
// Use of alpine.js x-id and $id magic method to make sure our labels are accessible and bind
// the checkbox to the layer.getVisible() function and toggle the property on change of the
// checkbox value. Finally, we use the label custom property to show the layer's label.
<div x-id="['legend-checkbox']">
<label x-bind:for="$id('legend-checkbox')" class="flex items-center">
<input type="checkbox" x-bind:checked="layer.getVisible()"
x-bind:id="$id('legend-checkbox')"
x-on:change="layer.setVisible(!layer.getVisible())"
class="rounded border-slate-300 text-[#3369A1] shadow-sm focus:border-indigo-300 focus:ring focus:ring-indigo-200 focus:ring-opacity-50">
<span class="ml-2 text-sm text-slate-600" x-text="layer.get('label')"></span>
</label>
</div>
</li>
</template>
</ul>
</div>
</div>
</div>
</div>
@once
@push('styles')
@vite(['resources/css/components/map.css'])
@endpush
@push('scripts')
@vite(['resources/js/components/map.js'])
@endpush
@endonce
- Let's add x-cloak to resources/css/app.css file:
@tailwind base;
@tailwind components;
@tailwind utilities;

[x-cloak] {
    display: none;
}
- Finally, we need to define the label custom property on the layers we are loading in resources/js/components/map.js:
(...)
            init() {
                this.map = new Map({
                    target: this.$refs.map,
                    layers: [
                        new TileLayer({
                            source: new OSM(),
                            label: 'OpenStreetMap',
                        }),
                        new VectorLayer({
                            source: new VectorSource({
                                features: this.features,
                            }),
                            style: this.styleFunction,
                            label: 'Monuments',
                        })
                    ],
                    view: new View({
                        projection: 'EPSG:4326',
                        center: [0, 0],
                        zoom: 2,
                    }),
                })
            },
(...)
After a "dr npm run build" and page reload in the browser, you should be able to see the layers' list in the legend and toggle their visibility with the checkboxes:
Stay along; in the next post, we will add different types of data to the map, and we will make our legend better.
The commit for this post is available here: vector-data-in-openlayers